


After Friday’s stellar jobs report—254,000 jobs added in September vs. the Dow Jones forecast of 15,000—stocks and Treasury yields initially reacted with a big jump. The data confirms the strength of the labor market and the US economy.
Let’s not forget, though, that a devastating hurricane ripped through six states, leaving people homeless, isolated, and without power. The hurricane would have caused job losses, especially in the services sector. We’ll know more in the next jobs report. Fortunately, the US dockworkers’ strike was short-lived, so its impact may have been very light.
The Macro Picture
The stronger-than-expected September jobs report resulted in increased investor optimism. In addition to a large increase in new jobs, unemployment fell to 4.1%, and average hourly earnings are up by 0.4%.
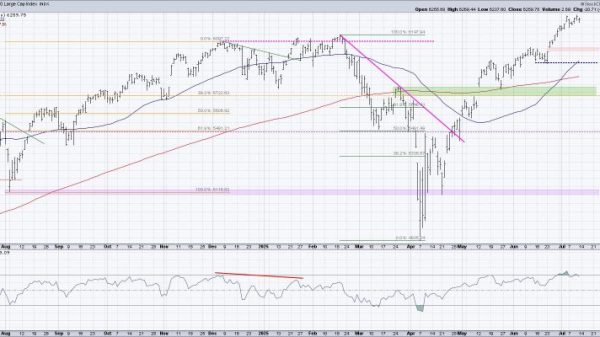
The broader stock market indexes closed higher into the close, which is unusual price action for a Friday when too many uncertainties are lingering. The daily chart of the S&P 500 ($SPX) below shows that after hitting an all-time high on September 26, the index pulled back close to its 21-day exponential moving average (EMA). Thursday’s doji candlestick represents indecision, and Friday’s jobs report reversed the indecision to optimism.
CHART 1. S&P 500 REMAINS BULLISH. The index bounced off its 21-day EMA with expanding market breadth. The number of 52-week highs outnumbers the new 52-week lows.Chart source: StockCharts.com. For educational purposes.
Overall, the S&P 500’s trend is bullish, and market breadth is expanding, with new 52-week highs greater than new 52-week lows.
The Nasdaq Composite ($COMPQ) closed above its August high (see chart below). Market breadth, measured by different indicators than those in the chart of the S&P 500, is also expanding.
CHART 2. NASDAQ BOUNCES ABOVE AUGUST HIGH. The Nasdaq has been trading sideways since its August high. Will today’s breakout from that high have enough momentum for follow-through action? The market breadth indicators give mixed signals.Chart source: StockCharts.com. For educational purposes.
The Nasdaq Composite Bullish Percent Index (BPI) is at 55.67, indicating slight bullishness. The Nasdaq Percent of Stocks above their 200-day moving average is at 44.54, which is relatively low, but it is trending higher. The Nasdaq Advance-Decline Line is trending lower, which is a little concerning. The Nasdaq hasn’t been as strong in its recovery as the S&P 500 and the Dow Jones Industrial Average ($INDU), which again eked out a record close.
Small-cap stocks rallied the most of the indexes featured in the StockCharts Market Overview panel on Your Dashboard. After falling below the trading range it’s been in for the last month, the S&P 600 Small Cap Index ($SML) is back within the range (area between dashed blue horizontal lines).
CHART 3. SMALL-CAP STOCKS TICK HIGHER. After Thursday’s price action, small-cap stocks picked up strength and made it back to close within their trading range. Advanced outnumber has declined, and the percentage of stocks trading above their 50-day moving average is also trending higher.Chart source: StockCharts.com. For educational purposes.
The market breadth indicators in the lower panel show that market breadth for $SML is also improving. The percentage of $SML stocks trading above their 50-day moving average is trending higher, and the number of advances and volume advance percent is higher.
The bond market also reacted strongly to the jobs report. Treasury yields rose after the news broke, with the 10-year US Treasury yield closing up 3.4% at 3.98%. This supports the notion that the Fed will likely slow down the pace of rate cuts. The CME FedWatch Tool reflects the probability of a 25 basis point interest rate cut in the Fed’s November 7 meeting at 98.9%.
Another important area to watch is volatility. The Cboe Volatility Index ($VIX) pulled back on Friday, closing at 19.21. But don’t be surprised to see it tick back up. Geopolitical turbulence is still front and center, and there’s an important election one month away. Investors should tread carefully, since any event could cause a volatility spike and change the picture.
Sector Performance
Crude oil prices rose this week, mostly due to Middle East tensions. The Energy sector was a laggard in the last several months, but it has now broken out of its downward-sloping trendline, ending the week as the top-performing sector.
The daily chart of XLE clearly shows a reversal in energy prices.
CHART 4. ENERGY SELECT SECTOR SPDR (XLE) BREAKS OUT. Rising geopolitical turbulence lifts oil prices higher. The S&P Energy Sector BPI also spiked, showing bullish dominance.Chart source: StockCharts.com. For educational purposes.
The S&P Energy Sector BPI spiked higher to 68.18 putting it into bullish territory. If tensions continue to escalate in the Middle East, oil prices could rise further.
To identify the stocks in the sector, pull up the StockCharts MarketCarpet, select 5D Change from the Color By dropdown menu, and click on Energy (see image below).
ENERGY SECTOR MARKET CARPET. It’s easy to see which were the top gainers in the sector. The table on the right can be sorted in ascending or descending order. Double click on any box to see the Symbol Summary page for the ticker symbol.Image source: StockCharts.com.
The table on the right shows the top-performing stocks in the sector.
Create a ChartList of energy stocks and populate it with the stocks listed in the table. Top performers as of this writing are Diamondback Energy (FANG), Williams Cos., Inc. (WMB), APA Corporation (APA), Occidental Petroleum (OXY), and Marathon (MRO). And don’t forget Vistra Energy (VST), the top StockCharts Technical Rank stock.
Before adding the stocks to your ChartList, you may want to analyze each one more closely. Double-clicking on the box of any stock will open the Symbol Summary page for the selected symbol.
Other Areas To Consider
Metals and stocks of Chinese companies have also been rallying. Gold, silver, and copper prices saw significant rises. The iShares China Large-Cap ETF (FXI) gapped higher, hitting a new 52-week high. Our blog posts cover both topics deeply, so check out the articles.
The first trading week of October ends on a strong note. But it is October, and historically, the month tends to be volatile, especially in an election year. Plus, earnings season kicks off at the end of next week. This means there’s all the more reason to be cautious.
End-of-Week Wrap-Up
S&P 500 closed up 0.22% for the week, at 5751.07, Dow Jones Industrial Average up 0.09% for the week at 42,352.75; Nasdaq Composite closed up 0.10% for the week at 18,137.95
$VIX up 13.27% for the week, closing at 19.21
Best performing sector for the week: Energy
Worst performing sector for the week: Consumer Staples
Top 5 Large Cap SCTR stocks: Vistra Energy Corp. (VST); KE Holdings, Inc. (BEKE); JD.com, Inc. (JD); Applovin Corp (APP); Carvana (CVNA)
On the Radar Next Week
Fed speeches
September Consumer Price Index (CPI)
September Producer Price Index (PPI)
Earnings season kicks off with JP Morgan Chase (JPM), Wells Fargo (WFC), and Delta Airlines (DAL)
Disclaimer: This blog is for educational purposes only and should not be construed as financial advice. The ideas and strategies should never be used without first assessing your own personal and financial situation, or without consulting a financial professional.