


The markets consolidated throughout the past week, which was a shortened one, with Monday, June 17th being a holiday on account of Bakri Eid. The past five sessions saw the markets staying in a capped range throughout the day. Even when the Nifty kept marking incremental highs, the intraday trend remained practically absent. The volatility also did not change much as compared to the last week, with the IndiaVix inching higher by just 2.79% to 13.18 on a weekly basis. The weekly trading range for the Nifty, too, remained much capped. The index oscillated in just 268.90-point range before posting a negligible weekly gain of 35.50 points (+0.15%).
The coming week is an expiry week for the monthly derivative series. Besides this, over the past sessions, the market has exhibited clear signs of fatigue. It has frequently formed weak candles on the daily chart, raising the possibility of it taking a breather and showing some measured corrective retracement. Going by the derivatives data as well, Nifty might face strong resistance in the 23600-23650 zone. This would mean that even if modest upsides are seen, a sustained and trending upmove cannot be expected unless the zone of 23600-23650 is taken out convincingly. Therefore, all moves on the upside should be used for guarding profits at higher levels.
A quiet start to the trade is expected on Monday; the levels of 23650 and 23790 may act as resistance points for Nifty. The supports come in at the 23300 and 23180 levels.
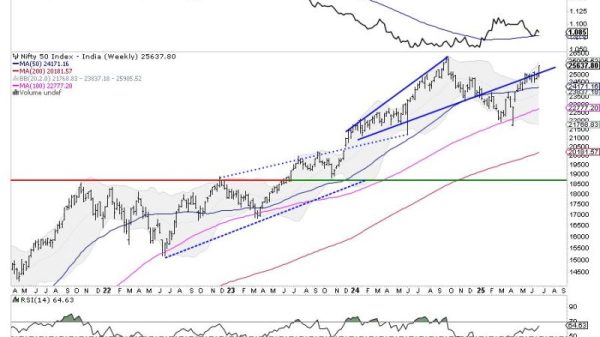
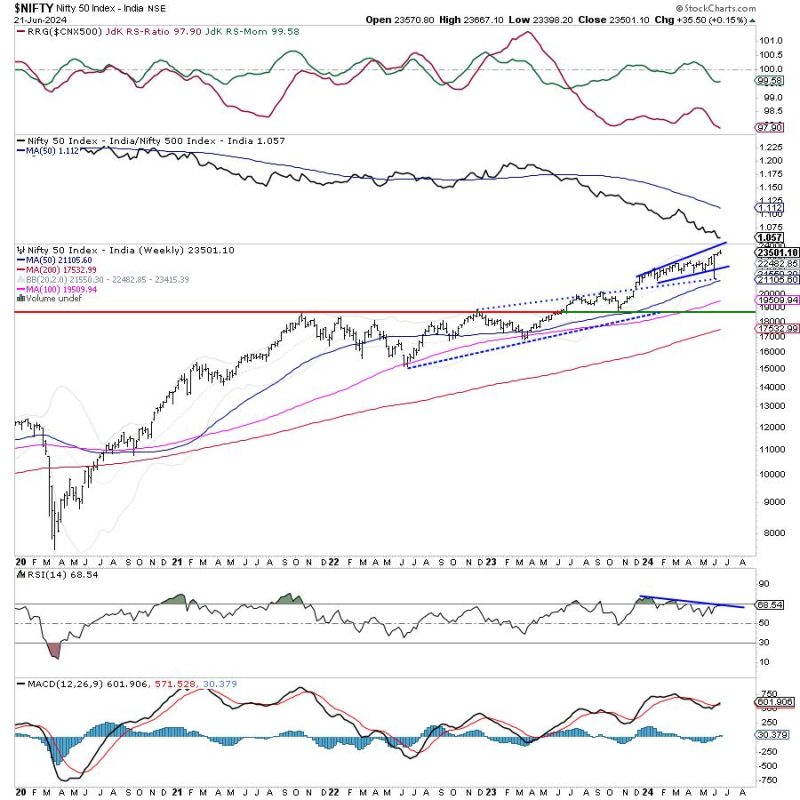
The weekly RSI is at 68.54; it continues to show bearish divergence against price, as it is not marking fresh highs along with the price. The weekly MACD is bullish and remains above the signal line. A spinning top has emerged on the candles; this not only reflects the indecisiveness of market participants, but such formations also have the potential to stalling an ongoing uptrend if they are formed near the high point.
The pattern analysis shows the Nifty trying to break above the small rising channel that it has formed. However, the Index is seen forming incremental highs, but it is unable to achieve a clean breakout. Unless the zone of 23600-23650 is taken out convincingly, the markets may find it difficult to have a sustained and trending upmove.
All and all, the current technical setup shows a lot of indecisiveness, discomfort, and tentativeness of market participants. The present structure warrants that we do not chase the up-moves blindly; instead, unless a trending move takes place, we utilize these moves to guard profits at higher levels. It would be prudent to protect and take profits in the stocks that have run up too hard and rotate the investments into the stocks that are showing promising chart setup and improving relative strength. While keeping leveraged exposures at modest levels, it is recommended you rotate investments effectively while maintaining a cautious view on the markets for the coming week.
Sector Analysis for the Coming Week
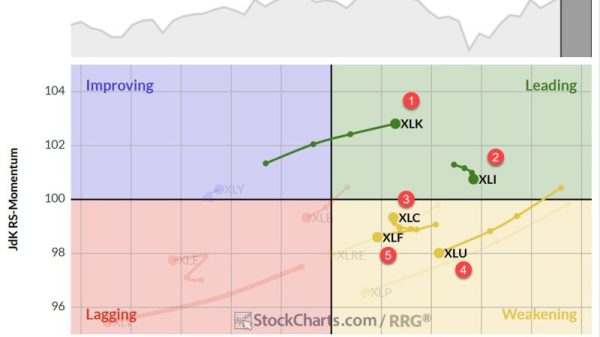
In our look at Relative Rotation Graphs®, we compared various sectors against CNX500 (NIFTY 500 Index), which represents over 95% of the free float market cap of all the stocks listed.
Relative Rotation Graphs (RRG) show that the Nifty Metal Index is giving up on its relative momentum, while staying inside the leading quadrant. Besides this, the Realty, Consumption, Auto, and Midcap 100 indices are also inside the leading quadrant. Collectively, these groups may relatively outperform the broader markets.
The Nifty Infrastructure, PSE, PSU Banks, Energy, and Commodities Index stay inside the weakening quadrant.
The Nifty Pharma index has entered the lagging quadrant. Besides this, the Services Sector Index and IT Index are also inside the lagging quadrant. The Services Sector Index appears weaker; however, the IT and the Pharma Index are seen improving their relative momentum against the broader markets.
Banknifty, Nifty Media, Financial Services, and FMCG indices are placed inside the improving quadrant.
Important Note: RRG charts show the relative strength and momentum of a group of stocks. In the above chart, they show relative performance against NIFTY500 Index (Broader Markets) and should not be used directly as buy or sell signals.
Milan Vaishnav, CMT, MSTA
Consulting Technical Analyst